Penrose Diagrams
Update! xhorizon now live with docs and pip install for Python!
*Download or directly view image files for higher resolution.*
Penrose diagrams are a tool for visualizing the causal structure of curved spacetimes.
In these diagrams, causal cones emanate from each point at 45 degree angles, just like in flat Minkowski space.
For more info see arxiv:1802.02263, arxiv:1907.04879, and xhorizon.
All diagrams below are xhorizon diagrams unless otherwise stated.
Jump to section:
- Minkowski
- dS and AdS
- Schwarzschild
- Reissner Nordstrom
- Schwarzschild Formed by Collapse
- Shell Collisions
- Schematic: Forming and Evaporating Black Hole
- Forming and Evaporating Hayward Black Hole
- Forming and Evaporating Black Hole in dS/AdS Background
- Miscellaneous
All metrics below locally have the form
\( ds^2 = -f(r) \, dt^2 + f(r)^{-1} \, dr^2 + r^2 \; d\Omega^2\).
Time dependence arises by gluing these local metrics along null shell junctions.
The "mass function" \(m(r) \) is defined by \(f(r) = 1 - 2 \, m(r) /r \).
Conformal vs. Coordinate Diagrams: Diagrams shown here are exact coordinate diagrams of the spacetime in "Penrose diagram coordinates". That is, in coordinates that allow one to read off the causal structure. This allows internal causal structure to be depicted as well as the structure of infinity. See Sec. IV of arxiv:1907.04879 for further discussion.
Minkowski

dS and AdS


Schwarzschild
xhorizon diagram

Classic Kruskal style diagram.
Schwarzschild radius is R=1. (a) Constant radius line spacing is dr=0.1. (b) The \(\partial_t\) Killing vector field.
Reflection symmetry within individual blocks of the Kruskal diagram arises from the interesting fact that \( \tan^{-1} e^x - \pi/4 \) is odd.


In Kerr-Schild Coordinates
***This \(t\) is not the same as Schwarzschild time***
This depicts an ingoing patch of Schwarzschild spacetime in Kerr-Schild coordinates, using an xhorizon diagram. The metric is \[ ds^2 = -dt^2 + dr^2 + r^2 \, d\Omega^2 + \tfrac{2m(r)}{r} \left( dt + dr \right)^2. \] While not so commonly used, this form of the metric is quite useful because: (1) it is written explicitly as a perturbation of the flat metric; and (2) it can be immediately extended to include rotation, charge, and other mass distributions. The Schwarzschild case is m(r) = M.

Reissner Nordstrom
The first case is nearly extremal. The second one, with a small charge, may be more realistic. Note how the small scale lines of constant radius bundle up.


Eternal Schwarzschild Formed by Shell Collapse
Constant radius line colors demonstrate radial matching at shell junction.


Shell Collisions
Radius line colors again demonstrate matching. Note that inspection of the diagram alone does not reveal whether DTR is satisfied at the shell collision point. Radius lines are necessarily wiggly as constrained by the matching transformations.


Schematic: Forming and Evaporating Black Hole
Here is a schematic diagram for a forming and evaporating black hole.
This type of model follows on the works of Hiscock and Davies Fulling and Unruh; it is based on known semi-classical gravity effects, but is not known to be an exact model. The metric is effectively \[ds^2 = - \left(1 - \tfrac{2 \, m(u,v)}{r(u,v)}\right) du \, dv + r(u,v)^2 \, d\Omega^2 \] where the mass varies as a function of some null coordinates as depicted. However, note that that is a slight oversimplification.
For more details see Sec. III of arxiv:2012.07973.
(Left) Schwarzschild. (Right) Same but with Hayward center; in this case there is a regular core and both inner and outer apparent horizons.


Forming and Evaporating Hayward Black Hole
The spacetime depicted in this section is the Hayward case of the above schematic. (For Schwarzschild case, just replace outer core surface with singularity.)
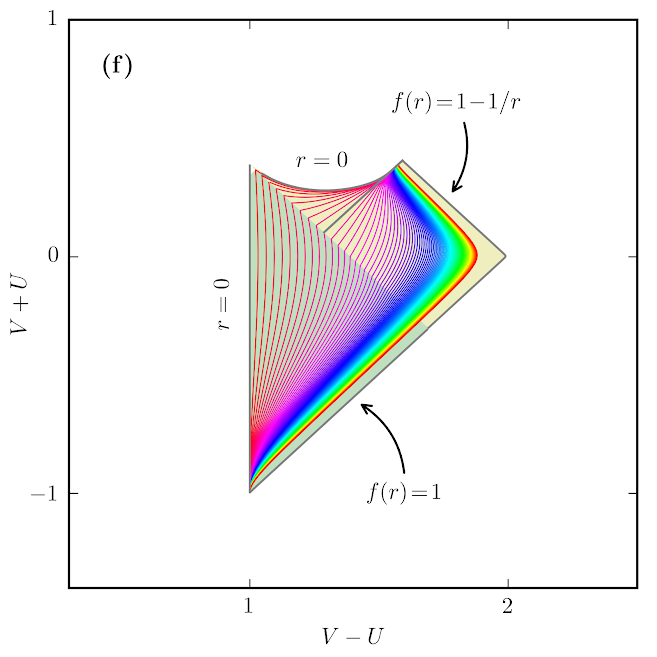
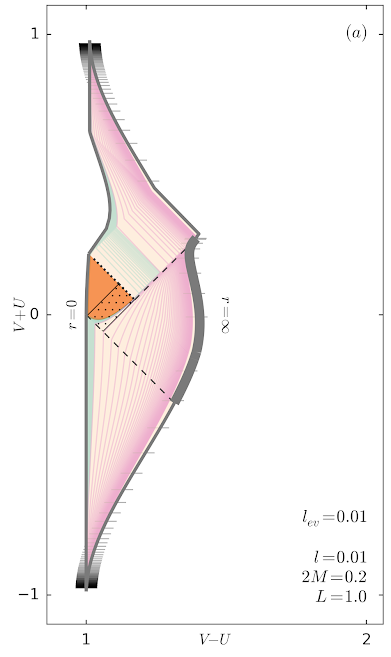
All three diagrams shown depict exactly the same spacetime. Although they look quite different, they are related by conformal transformations in the UV plane. Notice that some lines appearing null are only nearly so, and that in (c) the dense orange region is squished out of view (hidden behind the r=0 line). Each is useful for depicting a different timescale of the formation/evaporation process.
The orange region is an extremely dense "core" where quantum gravity effects are likely important. The apparent horizon is the boundary of the trapped sphere region (dotted fill). Lines of constant radius appear at various scales. Shells are shown by dotted and dashed lines. Tick marks depict equal intervals of proper time for an observer at infinity.
For more details see arxiv:1907.04879.


The time dependence is approximated by shells in above figures as shown here on the left. On the right is a zoom of the formation process (although with slightly different parameters). You can see the apparent horizon jumping outward (becoming spacelike) during formation, and jumping inward (becoming timelike) during evaporation, while it is null in static patches.


Forming and Evaporating Black Hole in dS/AdS Background
These are simplified models where formation/evaporation each occur in a single burst.
Shown are Minkowski, de Sitter, and Anti de Sitter backgrounds.
These have Hayward cores, but for Schwarzschild case just replace outer core surface with singularity.


Miscellaneous
Hayward spacetime in Kerr-Schild coordinates (here \(t\) is Kerr-Schild time, not Schwarzschild time).
